Color space conversion (1) — XYZ color space
CIE RGB and CIE XYZ color spaces
First, I will explain CIE RGB and CIE XYZ, which the CIE (Commission internationale de l'éclairage) defined in 1931.
Of these, the CIE XYZ color space is widely used as a basic color space when converting colors.
To represent colors as a mixture of the three primaries, CIE first selected the three primary colors from monochromatic lights.
For blue and green, they used the blue line at 435.8 nm and the green line at 546.1 nm from the readily available mercury spectrum lines (Fig. 1).
For red, they chose 700 nm light, which is close to the practically long wavelength limit of visible light.
By repeating the color matching experiment (see Fig. 2) in which a color created by mixing these three colors and an arbitrary color are visually checked (see Fig. 2), the mixing ratio of the three components for reproducing colors of various wavelengths is determined.
The result is a curve called the RGB color matching function (Fig. 3).
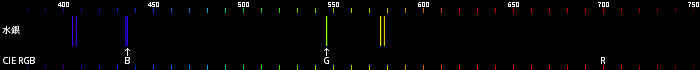 Fig. 1. The spectrum of mercury consists of several emission lines.
The numbers are wavelengths (units are nm).
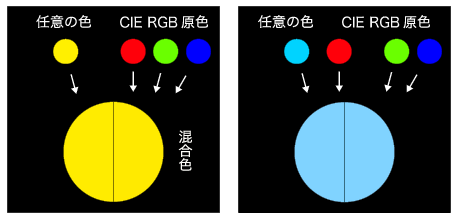 |
Fig. 2.
Conceptual diagram of the RGB color matching experiments.
The mixing ratio is determined by adjusting the mixed color so that it looks the same as any given color (usually pure color).
If a given color is bluish-green, the saturation is too high to be reproduced by mixing colors, and the color matching is possible only by adding red to the given color.
Thus, for some colors, one of the mixing ratios may become negative.
|
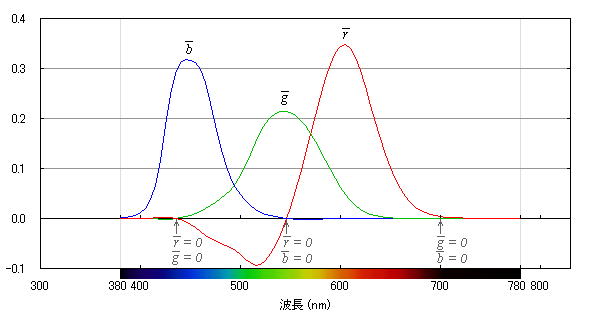 Fig. 3.
CIE RGB color matching function (1931).
Fig. 3.
CIE RGB color matching function (1931).
Colors indicated by the arrows are the three primaries of CIE RGB.
This color matching function was determined in 1931 based on the color vision at the center of the field of vision (viewing angle 2°).
Do not be confused with the color matching functions for viewing angle of 10°, determined in 1964.
Looking closely at Fig. 3, the color at 435.8 nm has only B, so
r and g are 0 there.
Similarly, at 546.1 nm,
r and b are 0.
There is a wavelength region where the matching function is negative.
This is because, when trying to reproduce a pure blue-green color by mixing the primaries, the saturation of the mixed color made with blue and green is too low so that the matching is possible only by adding red to the given color.
Note that the RGB color matching functions are normalized so that the areas under the three curves are equal to each other for simplicity.
The wavelength region used for the calculate defined as 380 nm to 780 nm, according to human vision.
The values of the
R, G, and B
components of the color can be obtained by integrating the energy distribution of light multiplied with the color matching functions, respectively.
Instead of the values of R, G, and B themselves, the proportions of the three components,
r, g, and b are often used:
r = R/(R+G+B),
g = G/(R+G+B), b
= B/(R+G+B).
Here,
r+g+b=1,
so that b = 1−r−g.
That is, b can be obtained easily from r and g.
The color space consisting of R,
G, and B
are three dimensional.
However, the chromaticity diagram consisting of
r and g
ignoring brightness is often used because it can be represented by a plane.
The chromaticity diagram is obtained by projecting the RGB values in three dimensions onto an
R+G+B=const plane from the origin,
and modifying the axes to be orthogonal.
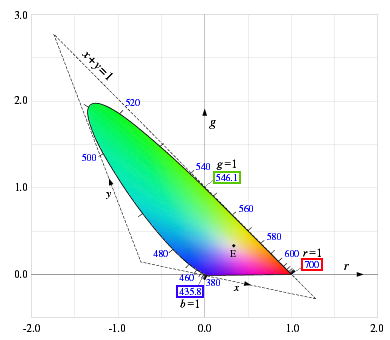
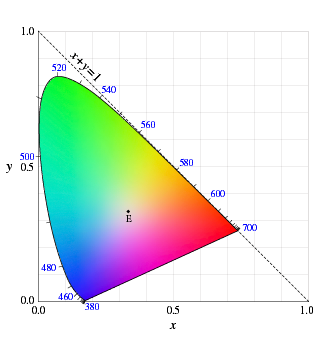
Fig. 4 shows all the colors that appears on the rg chromaticity diagram.
The outer curve represents the locus of monochromatic light, and numbers are the wavelengths.
The light of wavelength 700 nm corresponds to r=1,
546.1 nm corresponds to g=1,
and 435.8 nm corresponds to r=0, g=0, and b=1.
Point E is the white point of the E light source having a uniform (flat) energy distribution, where
r=g=b=1/3.
Since the value of r becomes negative from green to blue, it can be seen in Fig 4 that this part bulges out much to the left of the g-axis.
 |
 |
| Fig. 4. rg chromaticity diagram |
Fig. 5. xy chromaticity diagram |
By the way, the value of the RGB color matching function in Fig. 3 may be negative, so it is difficult to regard the function as the sensitivity of human eyes.
Negative values are also troublesome mathematically.
That is why the CIE XYZ color space has been invented, where the color matching function never becomes negative.
The values of XYZ can be obtained easily from RGB by linear transform (described later).
Instead of using the values of
X, Y, Z themselves,
the proportions of the three components are often used:
x = X/(X+Y+Z),
y = Y/(X+Y+Z), z
= Z/(X+Y+Z)
Here, x+y+z = 1,
so that z = 1−x−y hold.
By the way, in order to prevent XYZ values from becoming negative, it is necessary to make sure that all colors fall within the coordinate axes of the new XYZ color space.
In other words, it is sufficient to create a triangle represented by a broken line in the rg chromaticity diagram of FIG. 4 and use the two sides as XYZ coordinate axes.
First, from color matching experiments, it was found that when the three primary colors of CIE RGB are mixed at the inverse ratio of 1: 4.5907: 0.0601, the mixed color looks exactly the same as the white point E (color of the E light source, described later).
That is, R, G, and B are considered to contribute to the sensitivity of the eye cone at this ratio.
Therefore, we can define the lightness (usually denoted by Y ) as
Y = 1R + 4.5907G + 0.0601B.
The x-axis in Fig. 4 is the line of
Y=0.
The x+y=1 line in Fig. 4 is chosen to coincide with the tangent at the red end of the chromaticity diagram.
The remaining y-axis is determined by the conditions that
x=y=z=1/3
for the E light source and that the whole outer curve lies to the right of the axis.
The linear transformation from RGB to XYZ is determined in this way by the CIE as follows:

|
X |

|
|
|
0.49 |
0.31 |
0.20 |
|
|
R |
|
|
|
2.7689
|
1.7517 |
1.1302 |
|
|
R |
|
| Y |
= 5.6508 |
0.17697
|
0.81240
|
0.01063 |
G |
=
|
1.0000 |
4.5907 |
0.0601 |
G |
| Z |
|
0.00 |
0.01 |
0.99 |
B |
|
0.0000 |
0.0565 |
5.5943 |
B |
Converting the RGB color matching function using this transform yields the well-known XYZ color matching function (Fig. 6).
It is clear that the function value is positive or zero everywhere.
The chromaticity diagram with xy is shown in Fig. 5.
It is also clear that all the colors fall within the range of
x≥0, y≥0, x+y≤1.
The XYZ color space is a somewhat abstract color space introduced to avoid the drawback of negative RGB color matching functions.
The values of X, Y, and Z do not indicate the sensitivity of the three types of cone cells (L, M, and S) of the eye (especially, Y is not the sensitivity of M cones but the lightness by the total vision).
However, the absorption curves of the cone pigments found in subsequent studies resemble the XYZ color matching functions more or less.
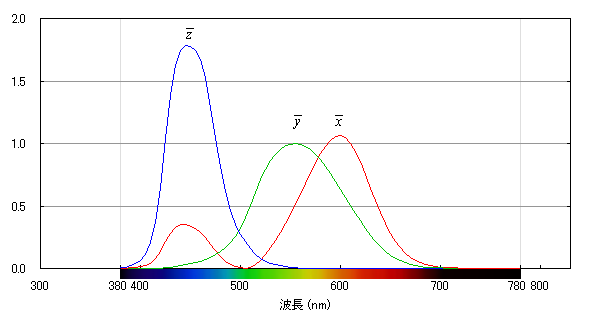 Fig. 6. CIE XYZ color matching function (1931).
The areas below the curves are equal to each other.
If the spectrum of light is given as a function of wavelength, integrating the intensity of the light multiplied with the color matching functions
x, y, z
over the wavelength yields the three components of XYZ.
If λ is the wavelength,
and P(λ) is the power spectrum of the light,
the components can be obtained by
X = ∫ P(λ) x(λ) dλ
Y = ∫ P(λ) y(λ) dλ
Z = ∫ P(λ) z(λ) dλ
(Note)
A luminous efficiency function is a curve showing the spectral sensitivity of human visual perception of brightness,
quantified by CIE.
There are two types of the luminous efficiency: the photopic luminosity efficiency (peaks at 555 nm), which represents the perception by cone cells under bright condition, and the scotopic luminous efficiency (peaks at 507 nm), which represent the colorless perception by rod cells under dark condition.
The color matching function y is defined to match the photopic luminous efficiency.
[Reference]
https://www.rit.edu/cos/colorscience/rc_useful_data.php
... Tables of CIE color matching functions, etc. (in the CSV format).
White point
An important factor when dealing with colors is the illuminant.
Since the color we see is usually reflected light, the color will be different if the illuminant is different.
CIE , therefore, determined several standard illuminant.
Fig. 7 shows the energy distribution of illuminants commonly used.
These are idealized illuminants of white color and defined as numerical tables.
First, E is an illuminant with a flat energy distribution, which was used to define CIE RGB and CIE XYZ.
C is an obsolete illuminant that emulates natural daylight, and was used for the NTSC (analog television standard).
D65 and D50 are the illuminants determined by the energy distribution of natural daylight.
D65 corresponds to daylight color (light coming from above on a clear day), and D50 corresponds to white light (light coming from the horizontal direction on a clear day).
The numbers 65 and 50 indicate that the color temperatures are approximately 6500K and 5000K, respectively.
 Fig. 7. Energy distribution of standard illuminants.
The wavelength region from 380nm to 780nm is used for calculation.
Table 1. White point of standard illuminant
| Illuminant |
xw |
yw |
zw |
Xw |
Yw |
Zw |
Remarks |
| E |
1/3 |
1/3 |
1/3 |
1.0 |
1.0
| 1.0 |
flat distribution (color temperature 5454 K) |
| D50 |
0.345703 |
0.358539 |
0.295758 |
0.9642 |
1.0 |
0.8249 |
emulated natural light (color temperature 5000 K) |
| D65 |
0.3127 |
0.3290 |
0.3583 |
0.95046 |
1.0 |
1.08906 |
emulated natural light (color temperature 6500 K)
|
C
|
0.31006 |
0.31616 |
0.37378 |
0.98071 |
1.0 |
1.18225 |
emulated natural light (color temperature 6774 K) |
When the energy distribution of illuminant is given, we can calculate the components of the illuminant (or the coordinates of white point), Xw, Yw, Zw, by integrating the energy distribution multiplied by the color matching functions.
Here, the values are usually normalized so that Yw=1.
Table 1 gives the components of some illuminants (or the coordinates of white points).
The lowercase symbol is the proportion of each component, satisfying the relation
xw+yw+zw = 1.
The coordinates of white point is needed for color space conversion.
[Note] Color temperature ...
When an ideal object with a black surface (black body) is heated, it emits heat radiation. The energy distribution of black body radiation (called the Planck distribution) is determined only by the temperature, and that temperature is called "color temperature".
It is expressed as an absolute temperature (Celsius temperature + 273.15), and is measured in units of K (Kelvin).
Since the surface temperature of the sun is about 6000 K, the color temperature around 6000 K corresponds to white.
At lower color temperatures, the color is dark and reddish (e.g., an incandescent lamp has a color temperature of about 2900 K).
Conversely, if the color temperature is high, the color becomes bluish (see XYZ color system).
Back to the contents
Previous Next
T. Fujiwara, 2011/12, 2019/09