|
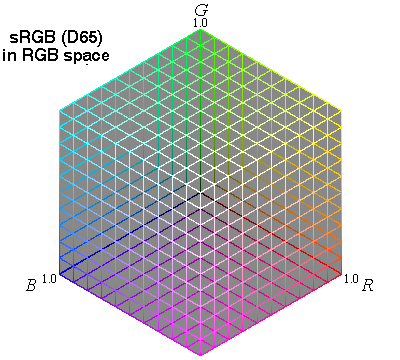
(1) sRGB color gamut in the RGB color space is a so-called color cube.
The RGB values of the image data (R',G',B') should be converted to the original linear values
(R,G,B) by the inverse gamma correction, at the beginning.
|
|
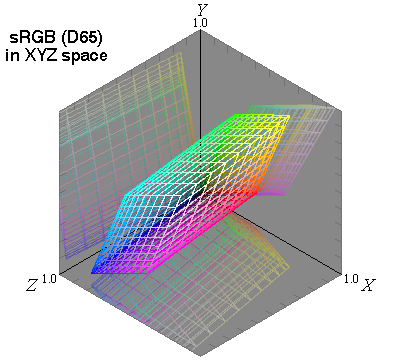
(2) The sRGB color gamut converted to the XYZ space is a parallelepiped.
Since the white point of sRGB is D65, the white vertex is slightly shifted to the blue direction.
|
|
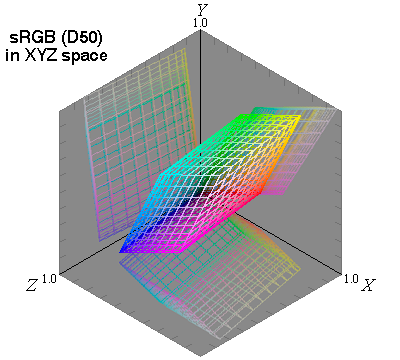
(3) The reference illuminant has been converted to D50 by chromatic adaptation conversion (Bradford transformation).
The white point is slightly shifted to the yellow direction.
This conversion is necessary because Lab system usually uses D50 illuminant.
|
|
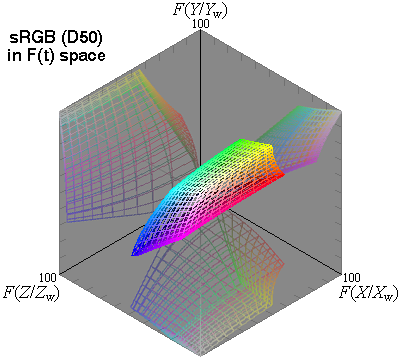
(4) In order to see how the color gamut is deformed by the conversion to Lab, we show the stage where the above gamut has been converted by the function F(t).
Since this is a non-linear conversion, the parallelogram is distorted as shown in the figure.
Note that the white point is in the middle of the figure, because the maximum values of XYZ are set to 1.0 before the conversion.
|
|
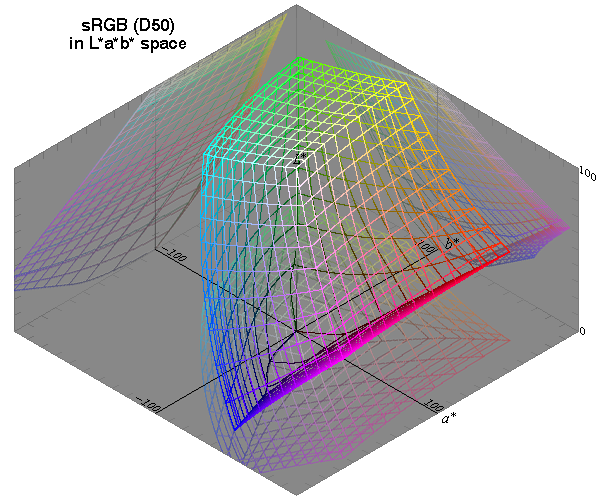
(5) The achromatic line in the above figure is sheared to the Y-axis to be use as the L* axis.
The X and Z axes are also scaled to be used as the a* and b* axes, respectively.
The value of L* falls in the range of 0-100, but a* and b* take negative values and varies in a wide range.
The stage (4) is shown for explanation only.
Usually stage (3) is converted directly to (5).
|


